


Support our independent tech coverage. Chrome Unboxed is written by real people, for real people—not search algorithms. Join Chrome Unboxed Plus for just $2 a month to get an ad-free experience, access to our private Discord, and more. Learn more about membership here.
START FREE TRIAL (MONTHLY)START FREE TRIAL (ANNUAL)
It has been a little less than three months since we discovered a new feature being developed for Chrome OS that will give users device-specific statistics, real-time resource usage, and diagnostic tools in one native system web app. To avoid any confusion, this is not the “connectivity diagnostics” app that we recently reported. This feature has been in development since mid-August and has undergone numerous updates since it arrived in the Canary channel of Chrome OS.
Previous updates brought a cleaner UI to the diagnostic app and eventually, the tool began reporting “dynamic” system data to include CPU and memory usage, CPU temperature, and basic information about the device’s hardware. I put dynamic in quotes because until recently, this information was just a generic mock-up from the developers that spit out a repeating pattern of system data and dummy hardware IDs. A more recent update to the Canary channel has brought the most significant changes we’ve seen in the fact that the diagnostic app is now reporting actual, real-time data from the Chrome OS system.
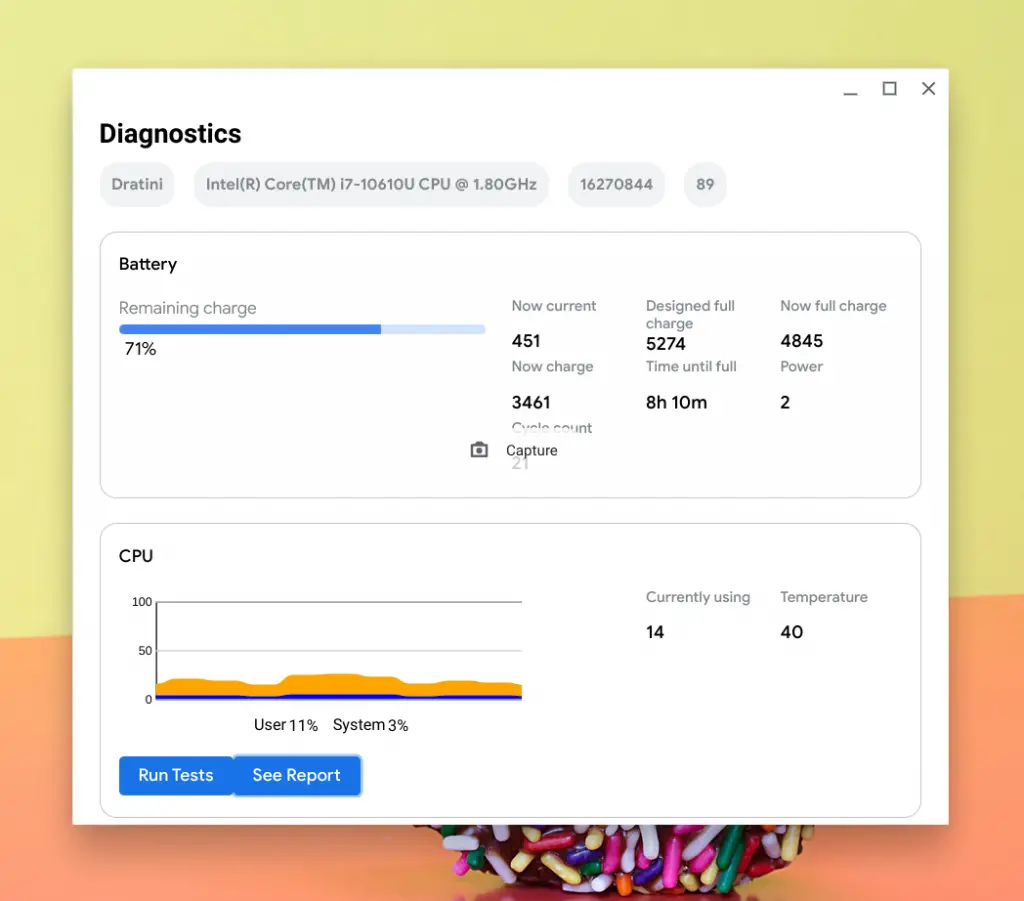
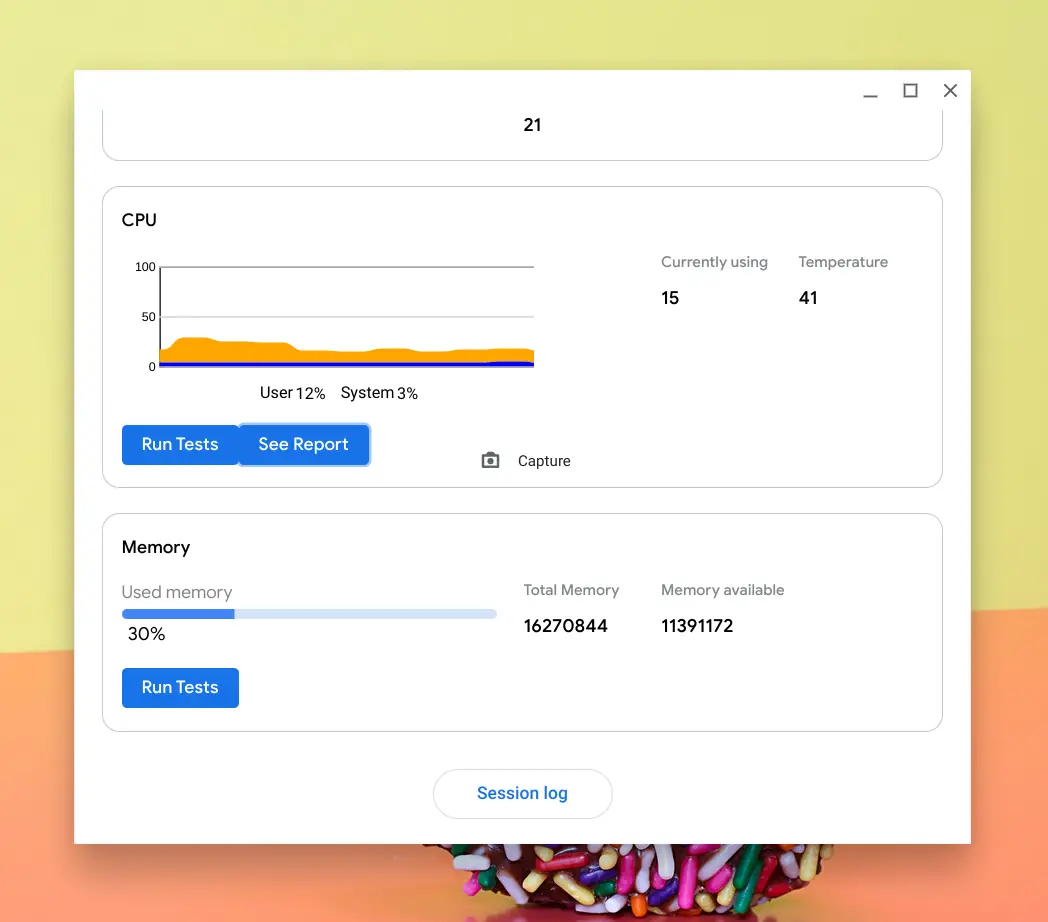
You can see in the image above, the device I am using is codenamed ‘Dratini’ which happens to be the HP Pro c640 Chromebook and it is rocking a 10th Gen Core i7 and 16270844 KB of memory or approximately 16GB. More importantly, further down the page, you can see dynamic CPU and memory usage, and right now, it appears to be very accurate when I compare it to the data reported by the COG system viewer app. You can also see current battery information such as charge remaining, the full charge amount, time until full, etc. This information is steadily staying within one percent of the battery info in the system tray. As I speculated, this data is likely pulling from the crosh shell battery test command.
The temperature output does not give you individual core temps like COG but the current display, which is in Celsius, appears to be an accurate mean of all the cores. All of this information is very useful as Chromebook users haven’t had an accessible, easy, and native way to get their hands on this information. Apps such as COG have been the go-to for those that know they exist. What makes this tool even more exciting is that it will also offer up a handful of diagnostic tests that can be useful in aiding users and developers alike when troubleshooting system errors.
Diagnostic tests
- kCpuStress
- kCpuCache
- kFloatingPoint
- kPrimeSearch
The tests include a handful of CPU diagnostics as well as a memory test. Once these tests are run, users can produce a session log. The session log doesn’t appear to be working at the moment but presumably, it will spit out some form of a spreadsheet with system information that you can send on to Chrome OS support or another relevant channel. There is still some work to be done on this system web app but it is shaping up to be a great addition to the growing number of tools in the Chrome OS arsenal. I’ll be watching this new tool along with the connectivity diagnostics application as I suspect they will be promoted up the ladder in the next couple of months.
SUBSCRIBE TO UPSTREAM
Get Chrome Unboxed delivered straight to your inbox
Upstream is our flagship, curated newsletter with the top stories, most click-worthy deals, giveaways, and trending articles from Chrome Unboxed sent directly to your inbox a few times a week. Join 31,000+ subscribers.